
 L Lemo-Opuscar
数据叙事
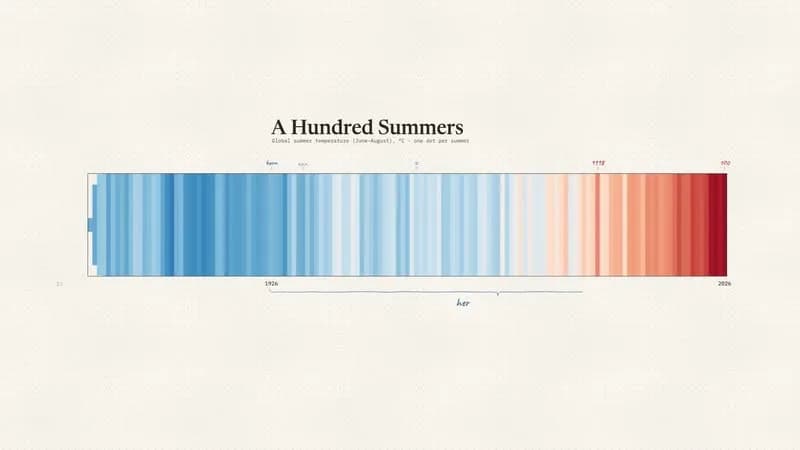
一百年的夏季气温,图表本身就是故事。
- 适合:
- 用图表讲故事
- 系列:
- L Lemo-Opuscar
- 更新:
- 2026-10-29
风格提示词
Data Storytelling — Style Prompt
A chart that tells a story: real data, drawn mark by mark on cream paper by a red–blue pencil, with handwritten notes pinned to the numbers. The chart itself is the camera, the rhythm and the plot.
References (grammar only): Hans Rosling's 200 Countries, 200 Years, 4 Minutes (one dot is a character), Ed Hawkins' warming stripes (a diverging ramp on a reference mean, no axes), The Pudding / NYT scrollytelling (one idea at a time, growing axes, pinned notes). Copy none of their charts, layouts or typefaces; never name them in the film.
1. Essence, and what it is not
The chart is the film. Every mark is a real number and every movement is a meaningful chart operation (a mark lands, an axis grows, the scale changes, a series morphs, a note is pinned). The data is real, openly licensed and traceable. You change the framing, never the numbers.
Pick the chart the data asks for:
| The data is about | Chart |
|---|---|
| comparing categories, rankings | bars, a ranked bar race |
| a relationship between two measures | scatter or bubble chart (one dot can be a character) |
| place | map, choropleth, dots on a map |
| parts of a whole, counts of people | unit / waffle chart, proportional squares |
| before → after | slope or dumbbell chart |
| a distribution | histogram, beeswarm |
| where things go | flow / Sankey |
| change over time | line or dot series, stripes, area |
Three layers make it a story, not an infographic: a human scale (handwritten notes pinned to marks), a performer (a physical pencil that draws every mark), and sonification (each mark is a pitch; the trend is heard before it is read).
Not a dashboard (one idea at a time), not a keynote with charts (no slides), never decoration.
2. Materials & rendering
- Paper: warm cream, fixed-seed fibre noise and a faint dot grid in world space. Ink: dark warm ink for axes and series, pale warm grey for grid and zero line, IBM Plex Mono ticks.
- Marks: data dots carry a thin ink ring so pale values stay visible on cream. A mark lands with a short pop and a thin ripple; suppress ripples when marks arrive closer than ~0.1 s.
- Handwriting (Caveat) in pencil, per-glyph jitter, graphite grain, written on as the tip dances over the x-height. Leaders are wobbly curves ending in an un-closed ring around the mark.
- The red–blue pencil: hex body, blue half / red half, sharpened wood cone. Only the tip end shows, from the lower right; its shadow drifts farther and softer with lift; sharp tip, soft body.
- Layout: a plot box fixed in world space, a memory zone for early notes, every note pinned in data space (value + pixel offset) so rescales keep the layout, a bottom band for the caption.
3. Colour logic
- Colour encodes one thing: the value. Diverging data uses a ramp (ColorBrewer RdBu family) centred on the mean of a meaningful reference period, with a symmetric span; data with no natural centre uses one sequential ramp. Everything else is ink on cream.
- Honesty beats drama: pale values stay pale; never stretch a ramp to make a change look bigger.
- The two pencil leads have meanings: blue for memories and human notes, red for records and warnings. A change of lead marks a turn.
- One
accentcolour may bypass the ramp for a mark that is not data (a logo, a highlight).
4. Type & subtitles
- The subtitle is the figure caption: a text serif (Newsreader), ink colour, left-aligned with the chart, ≤ 2 lines, with a hairline rule above it and a small mono kicker for the range drawn so far. Words appear on their whisper timestamps over a paper-colour band. Hold ≥ max(1.8 s, speech + 0.6 s).
- The title is the chart's own headline (Newsreader), set in world space above the plot; it fades when the camera is close and returns with the full view.
- No captions over a signature chart operation or a silence.
5. Motion quality
- The rhythm of the data is the rhythm of the film. Map the marks to a musical grid; to accelerate, one option is to divide the beat instead of changing tempo. Pick a tempo whose finest subdivision lands on whole frames (at 24 fps a minute has 1440 frames; the count of finest notes per minute must divide it), so picture and sound never drift.
- Pencil acting: lift before each tap, land with the shadow meeting the tip, a tiny rebound; hurry as data densifies, tremble like a seismograph needle at a peak. It can flinch (recoil and freeze), hesitate (hover before a mark) and exit (hand the story to the viewer).
- Rescale reads as ratchet clicks (stepped, each step eased); a calm rescale is smooth.
- Morph: a staggered sweep, each mark easing into its new form; notes fade as it passes and return as tiny marks.
- No fades to blank or dissolves. Transitions are chart operations: axis growth, pull-backs, rescales, morphs, a cell widening into the next frame.
6. Camera grammar
A 2D camera {x, y, zoom, roll} over one sheet of paper. A film is one take; a hard cut is rare and meaningful. The moves below are a vocabulary, not a route. Opening and ending come from the topic.
| Move | Expresses | Can serve |
|---|---|---|
| Extreme close-up on one mark, following its leader | One fact, one life | a single case; a named person |
| Full view first, then dive to one mark | The pattern before the case | a familiar trend; a myth to correct |
| Pull back as axes grow out of the marks | The frame arrives with the unit | naming the measure; widening a claim |
| Track the pencil, newest mark at ~60 % of width | Progress: the past behind, the future ahead | a series in time; a race; a queue |
| Pedestal with rising data, a Dutch angle creeping in | Escalation, unease | runaway growth; a debt |
| Punch-in over 2 frames, decaying shake, jolt on rescale | Surprise, a broken frame | an outlier; a crash |
| Fast pull-out, roll, small constant tremor | A rush | a boom; a cascade; a panic |
| Locked-off | The transformation is the movement | a morph; a slow reading |
| Hold on one mark, then pull back | The part inside the whole | a verdict; context |
| Pull and pan to add more real data | Scale switch | a longer record; the rest of the list |
| Lateral pan across notes in the memory zone | Recollection | a biography; a timeline of events |
Framing: subjects fill ≥ 1/3 of frame height at key moments. When the real axis scrolls off-screen, pin its tick labels to a paper strip at the frame edge (frozen pane).
7. Sound palette
- Ambience follows the places the notes evoke (J-cuts in, L-cuts out). Foley is graphite, paper and wood: tick-and-paper taps, scratches for handwriting, a ruler hiss for axes, a paper puncture for a broken frame, a wooden click for the pencil flip, ratchet teeth for a rescale, a paper sweep for a morph.
- Sonification is the music: pitch = value, rhythm = time density. Low values snap to a pentatonic scale, middle ones to semitones, extreme ones unquantized, with detune growing away from the reference. Timbre: a low-pass-gate "plonk" (sine + FM whose index rises with the value: wood → metal). Dense passages: quieter notes, decay ≤ 1.5 × the gap.
- Bed: detuned-saw pad, soft kick, noise shaker, low-passed hats, sine sub, sample-and-hold blips, drones; harmony can darken or brighten with the data.
- Silence is a tool: true digital silence (all layers) where the data should be heard alone, before a key mark, a morph or a verdict; the first sound after it matters most.
- Mix: compressed calm, neutral narration, music ducked ~−11 dB, foley light except key taps; −14 LUFS, no grain. The voice never talks over a rush, a silence or a morph.
8. Native moves
A menu: use the ones your story needs.
- One mark = one fact. Fits content like: the first store a chain opened; the first patient of a trial; the first satellite launched.
- Axes grow with the story. The y axis arrives when the narration first names the unit. Fits content like: revenue; a city's population; vaccination rates.
- Pinned annotations. Their content and colour carry the arc. Fits content like: an athlete's season; a family's migrations; releases on a usage curve.
- Breaking the frame. The chart must make room; the torn edge stays as a scar. Fits content like: a viral spike; a price bubble; a record-breaking flood.
- Encoding morph. Bars into a waffle, a map into a ranking, a line into a slope: the reveal of the whole. Fits content like: a budget as units of people; countries as a ranking; daily steps as a year strip.
- Scale switch. One value → the series → a longer real record, never extrapolated. Fits content like: one day's energy use → a year; one species count → a region.
- The empty next cell. A dashed slot for the value nobody knows yet. Fits content like: next year's election; the next launch; tomorrow's reading.
9. Pitfalls of the medium
- Select data columns by header name, never by index; print every fact the narration claims.
- Notes collide with later data → data-space pins, a memory zone.
- A frame break rescaled too fast is invisible → hold the pierced state ≥ half a beat.
- Right-aligned notes are still written left to right → the pencil hops to the first letter.
- Helpers that set
globalAlphamust multiply the incoming alpha, or fades skip them. - Tails leak across a hard silence → render before/after in separate buffers; verify on decoded samples.
- In dense passages the pencil body lies across fresh marks → steepen its angle.
- Synthesized human sounds (a laugh) are uncanny → use a soft non-human sound.
10. Engine
demo/engine.js (Canvas 2D, world units = chart pixels at zoom 1) is the style: paper, camera, value ramps, pencilStroke (any polyline in pencil), inkShape (any closed shape: bars, areas, map shapes), plotShape, handText, dataDot, morphMark, annotation geometry, drawPencil, caption. demo/music/score.py holds the sonification. The function table and a minimal example are in DEMO.md.
11. Variation space
You decide the dataset, the chart, the human scale, the notes, the opening, the ending, the camera path, the pacing and the silences. All far from our demo:
- Structures: a ranked race (bars climb and overtake; one bar is the character; a newcomer breaks the frame from below); a map that becomes a count (dots gather on a map as events happen, then fall into a unit chart of people in one morph); before → after dialogue (two years face each other as a slope chart; one line left unfinished).
- Openings: the finished chart (the whole pattern is already drawn; the film works backwards); the object before the axis (a pencil drawing of the thing measured, a ticket, a shoe, becomes the first mark); the question first (an empty plot with only the unit and a handwritten question; the pencil hovers).
- Endings: one mark, close (end on a single value and its note, never the full view); back to the object (the chart folds into a drawing of the thing it measured); the headline revised (the pencil strikes a word of the title and writes the true one).
How our demo was made (story, shots, score, end card, build): DEMO.md. Read it after your treatment exists.
补充
示范片
A Hundred Summers
本风格的来源项目:开源项目 Lemo-Opuscar(项目仓库)。本站保留原项目署名,具体许可以该项目仓库为准。
分享来源:B 站视频(341 种代码动画风格)